For Brokers · Performance Analytics
Know Your Numbers. Run a Better Team.
Revenue by month, deals by broker, provider activity at a glance. The performance data you need to manage your team and your book — without a separate reporting tool.
Performance analytics are available on the Professional plan and above.
Monthly
Revenue Breakdown
Per Broker
Performance View
CSV
Export Any View
Real-Time
Always Current
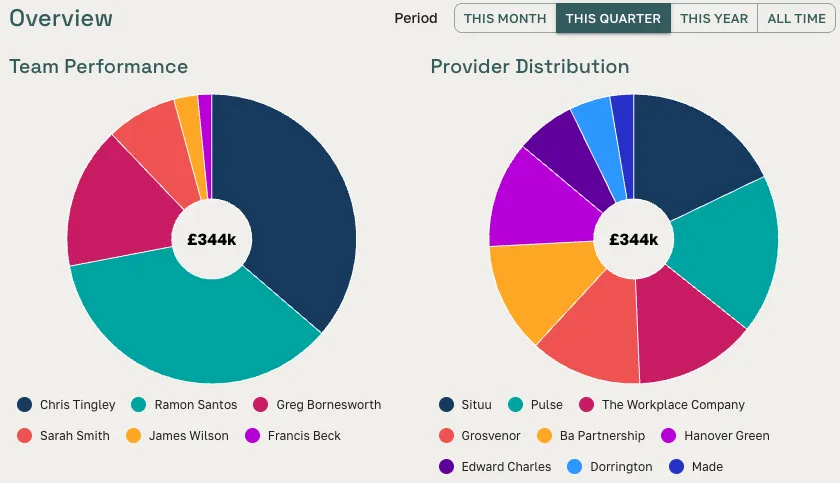
Revenue Dashboard
Your revenue picture, at a glance
The performance dashboard gives managers and admins a real-time view of the team's revenue. See total earnings by month or quarter, broken down by broker. Switch between periods to compare, spot the quiet months, and identify where growth is coming from.
- Monthly and quarterly revenue with year-on-year comparison
- Per-broker breakdown — deals closed and commission earned
- Filter by period: current month, quarter, year, or all time
Features
Everything you need to manage performance
No spreadsheets. No separate BI tool. The analytics you need are built into the same platform where the deals happen.
Monthly and Quarterly Revenue
See total revenue broken down by month and quarter. Switch between periods to identify trends, spot quiet patches, and project ahead with confidence.
Performance by Broker
See how every member of your team is performing — deals closed, revenue generated, and share of the book. Manage by data, not by intuition.
Requirements Breakdown
Track closed, active, and archived requirements across the team — per broker, per period, per client. Understand where your throughput is coming from.
Provider Activity
See which providers you're working with most — who's responding, who's contributing to closed deals, and where your most reliable operator relationships are.
CSV Export
Download any view as a spreadsheet. Share it with partners, file it for compliance, or import it into your own reporting system.
Available to Managers and Admins
Performance data is visible to team roles with Manager or Admin access — keeping deal-level detail private to the broker who owns it.
Team Tracking
See who's contributing — and who needs support
The team performance table shows every broker's activity over any selected period — requirements sent, spaces shortlisted, deals closed, and commission generated. At a glance you can see whether the team is on track, who needs a hand, and where your pipeline is strongest.
- Deal count and revenue per broker, any period
- Requirements, shortlists, and viewings per member
- Export the full table to CSV for offline review or partner reporting
Manual reporting vs. Great Space analytics
Without Great Space
- × Export from your CRM, clean the data, paste into a spreadsheet
- × Manually total up revenue by broker for the monthly review
- × No visibility into provider relationships or which operators drive most deals
- × Reporting is always a weekend or end-of-month exercise, never real-time
With Great Space
- Revenue dashboard is always live — no manual steps
- Per-broker performance in one table, any period
- Provider activity shows which operators contribute most to closed deals
- CSV export for external reporting in seconds
Pricing
Available on Professional and above
Performance analytics are available from the Professional plan (£99/month). The Starter tier includes the full broker workflow — requirements, presentations, viewings, and pipeline — so you can build your book before you need team management and reporting.
Run your team on real data
Start free and upgrade when you need team management and performance reporting.